What is Driving the Latest Market Sell Off?
Lately there has been a lot of chatter about a recession hitting the U.S. This article will look at some of the historical data points that have been good predictors of recessions. Last quarter the GDP Report came out showing the economy shrunk by -1.4%. But first what do you think is driving this sell off? Is it a recession? A policy mistake by the fed/hard landing? Is it inflation related? Are stocks just in general overvalued? Do you think this is going to similar to 2000 all over again or more like 2008? Let’s dig in.
The Nasdaq is down 30% from all time highs this year and the S&P is down than 17% from all time highs. Inflation is still running red hot with the latest reading coming in at 8.3%. The Fed is now hiking interest rates by 50 Basis Points with a current Fed Funds Rate target of 2.75-3% by year end. The CME Fed Watch Tool is suggesting a 75 basis point hike might not be off the table just yet. The housing market had one of its best years ever. April was all about the yield curve inversion of the 10 and 2 year treasury.
We will look at the following data points:
1.) The Stock Market
2.) The Yield Curve
3.) Inflation
The Stock Market:
The Stock Market is not only oversold but seems to be pricing in a recession. It is important to remember the stock market is a forward looking discounting mechanism whereas the economy is backwards looking. The fact the Nasdaq is down 29% from all time highs is a statistical outlier. This has only happened 8 times going all the way back to 1978. The Nasdaq hits its low this year on 5/24/2022 when it closed down 30% from all time highs. The number of times the Nasdaq has fallen 30% or more from all time highs has only happened 8 times. Each of these events is explainable. So lets dig into it.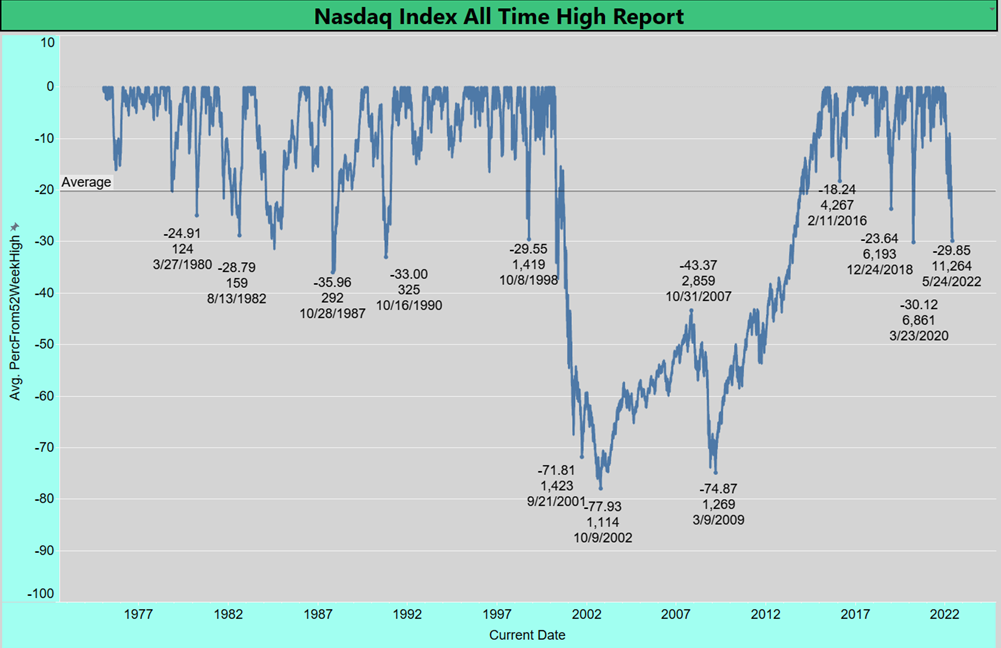
The 8 times the Nasdaq fell more than 30% from all times highs were:
- On 7/25/1984 the Market fell more than 30% from all time highs. The cause of this drop was because of the Federal Reserve Tightening Monetary Policy. This did not lead to a recession but did lead to a brief dip and a sharp recovery.
- The 36% drop from peak to trough on 10/28/1987 can be explained by the Black Monday Crash. This did not lead to a recession.
- The stock market fell 33% from all time highs in October of 1990. This drop was caused by the U.S. being in a brief recession that started on 7/1/1990 and ended on 3/31/1991. It took 107 days for the market to bottom from the start of the recession. The Market peaked on 10/9/1989 and it took 372 days to bottom out at $325 on 10/16/1990.
- In October of 1998 the Nasdaq tanked 29.55%. This was caused by a major Hedge Fund called Long Term Capital Management. In 1998 Long Term Capital Management collapsed which dragged equity markets down. This rattled markets and led to a $3.5 Billion bailout of Long Term Capital Management Engineered by the Fed. The fund engaged in algorithmic trading in which derivatives caused it to collapse. Markets got spooked by this.
- The Dot Com Bubble burst in 2000 led to two years of bad returns. First in 2000 the Dot Com bubble burst, then in 2001 the 9/11 attacks happened and then shortly after that the Enron and WorldCom scandals dragged the market lower. When all the dust was settled the Nasdaq fell 78% from peak to trough. It took the Nasdaq 15 years to surpass its all time high of $5,049 on 3/10/2000 to finally hitting $5,056 on 4/23/2015. The events of the dot com bubble did eventually lead to a recession.
- The Housing Bubble of 2008/Great Financial Crisis. The Nasdaq fell 56% from 2007 to 2009 when it eventually bottomed on 3/9/2009. This 56% decline was strictly drive by the housing collapse.
- The Coronavirus Recession – The Coronavirus Recession was a short lived recession only lasting about 6 months. This was caused by governments around the world shutting down businesses to reduce the spread of the virus. The market fell 30% as a result of this. But rebounded quickly after the government and Federal Reserve took extreme measures such as stimulus checks and lowering interest rates to 0% to keep the economy from faltering more leaving to a V shape recovery.
- The bear market of 20222. It is to be determined what the cause of this is. An argument can be said for inflation, or the fed tightening raising rates by 50 basis points at each meeting, or it could be the fact we are actually in a recession. Time will tell for this. As it stands the Nasdaq is down 30% from all time highs. The Nasdaq also has its worst start to the year going all the back to 1939.
Other notable sell offs the market that were significant but less than 30%
- 1980 Recession – The Nasdaq fell 25% from peak to trough during the 1980 recession.
- 1982 Recession – The Nasdaq fell 29% from peak to trough during the 1982 recession.
- Fed Tightening in 2018. During the raising interest rates in 2018 the market went down from October to December finally bottoming on Christmas Eve at 24% from peak to trough.
The Yield Curve:
The Yield Curve in general has been a good indicator to watch when it comes to predicting recessions. An inverted yield curve has predicted 8 of the last 9 recessions. A recession usually hits anywhere from 6 months to 24 months after a yield curve inversion. The yield curve only inverted for a couple days in April. For this to be more accurate we would have liked to see the yield curve invert for a little bit of a longer time frame. An inverted yield curve is taking the different between the 10 year treasury and the 2 year treasury and if the difference in negative then that means the yield curve is inverted. See the graph below which shows when the yield curve inverted and when a recession hit: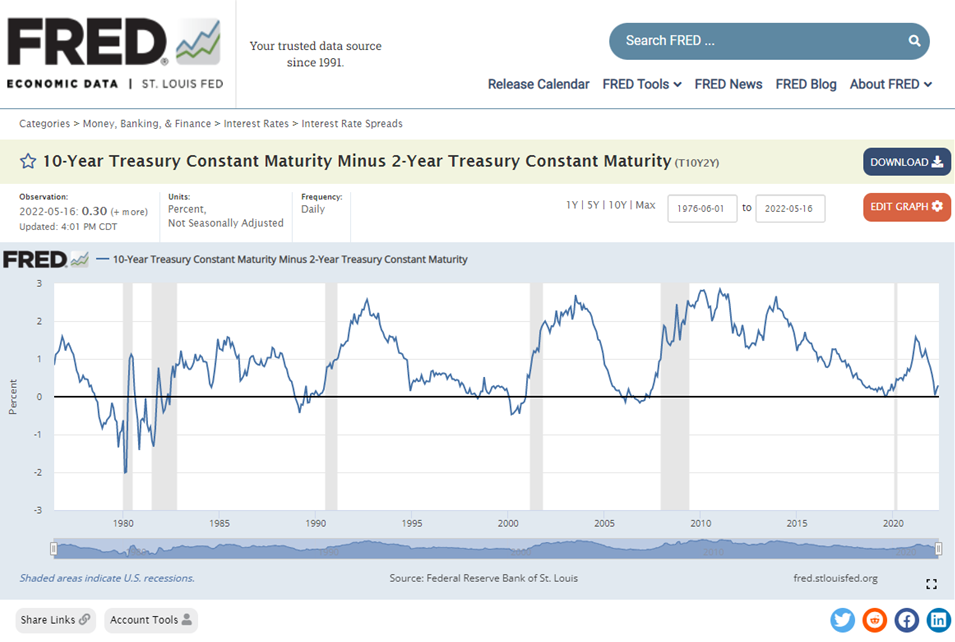
An inverted yield curve is where concern over the economy is so great that investors are accepting lower returns just to ensure they have a long term source of interest. As the curve flattens or inverts it could hurt the profitability of financial institutions and can make access to capital difficult for corporations. People sometimes generally watch the curve closely because it essentially gauges investor expectations.
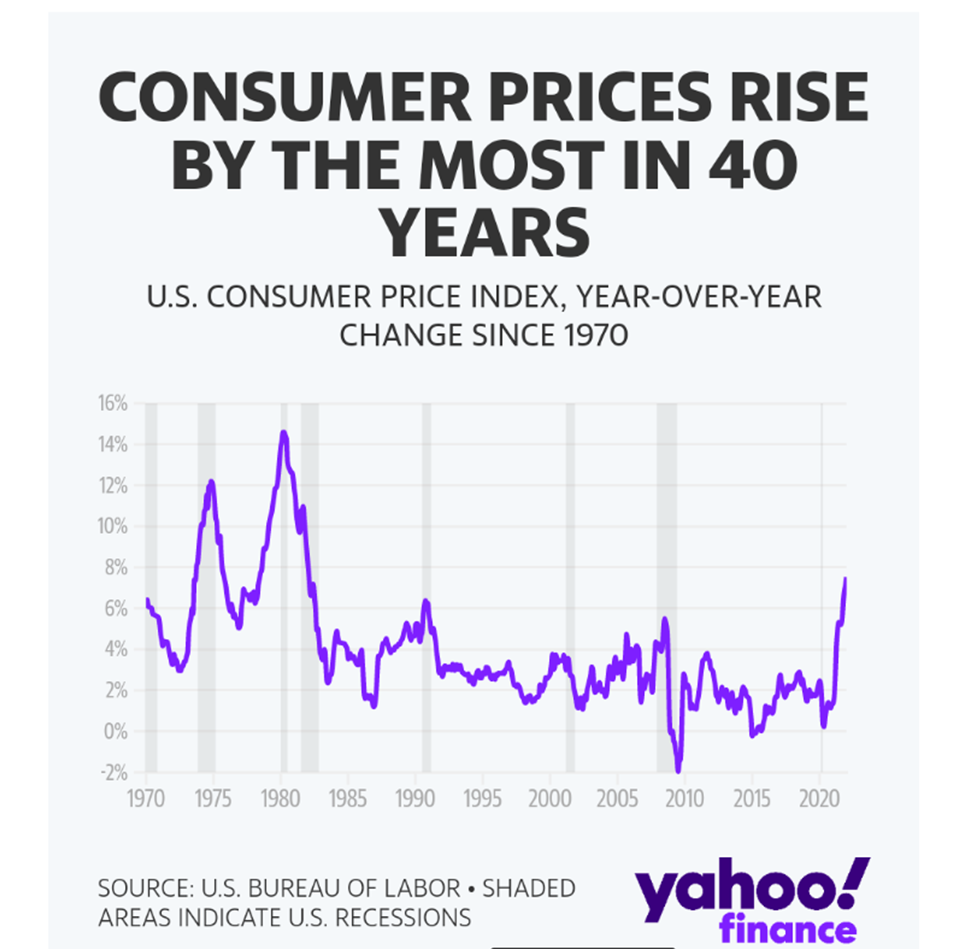
Inflation:
Inflation could be an interesting predictor of recessions. If you look at the graph below. Most of big spikes in inflation led to a recession later on: