The Nasdaq Stock Market is an American stock exchange based in New York City. It is ranked second on the list of stock exchanges by market capitalization of shares traded, behind the New York Stock Exchange. The exchange platform is owned by Nasdaq, Inc., which also owns the Nasdaq Nordic stock market network and several U.S. stock and options exchanges.
All data and analysis provided here are for information only. All data and analysis contained herein are provided without warranty or guarantee of any kind, either expressed or implied. Using this data and analysis could incur substantial financial losses. The provider of this data and analysis shall not have any liability for any loss sustained by anyone who has relied on the data and analysis contained herein. The provider of this data and analysis makes no representation
or warranty that the information contained herein is accurate, fair, or correct or that any transaction is appropriate for any person and it should not be relied on as such.
Related Reports
Stock Screener Tutorial
Stock Screener Tutorial
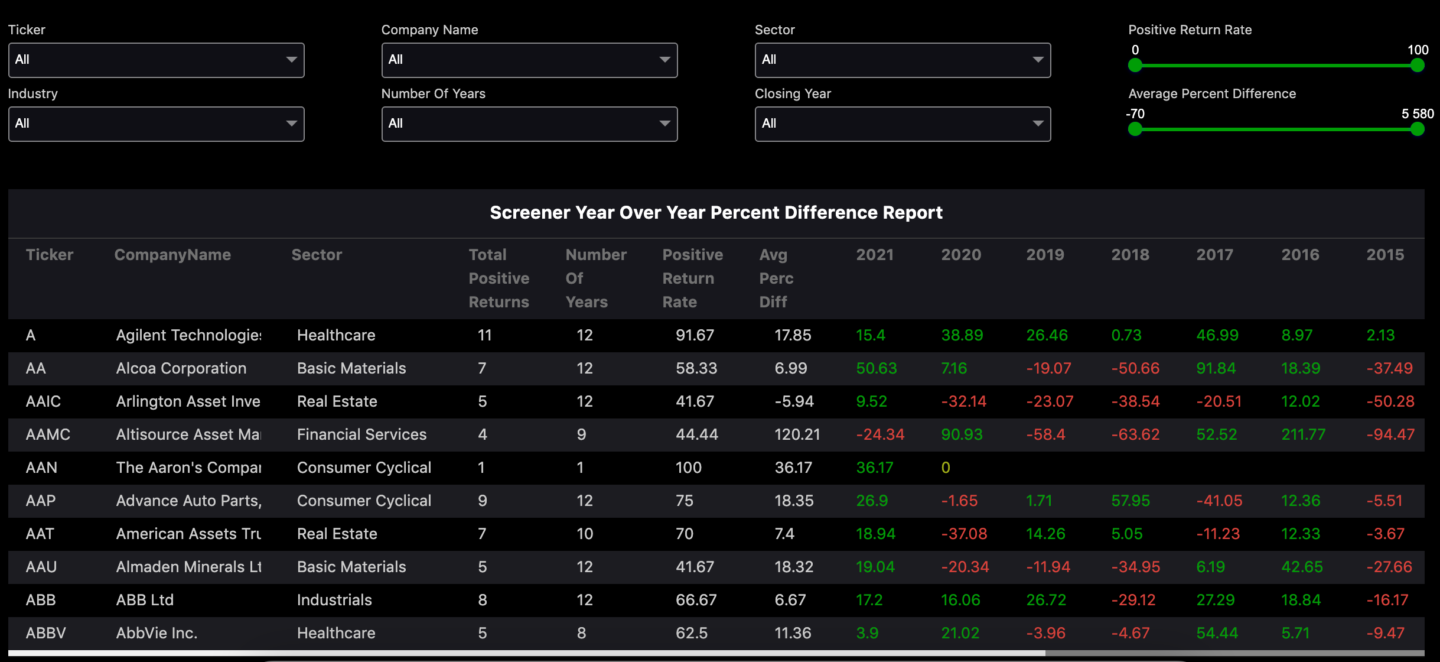
The Stock Screener shows you Year over Year Returns of all stocks on the NYSE and Nasdaq Going back to 2010.
In this report you will find columns such as Total Positive Returns, Number of Years, Positive Return Rate and Average Percent Difference.
This report will help you drill down by these columns. For example if you want find stocks that have given the highest average year over year return going back to 2010. You can accomplish this by Sorting by Average Perc Difference. It is important to note this Percent Difference includes both Positive and Negative Returns. You can also filter this by year end date to take out negative years or take out positive years to see how bad a stock does if you are expecting the market to have a bad year.
This report also has a column called Positive Return Rate. How this calculation works is it looks at a stocks number of total positive returns (in the numerator) over the total number of years trading going back to 2010. So if a stock has been trading for 10 years on the market and 9 of those years it gave a positive return. The Positive Return Rate would be 90% or (9 Positive Returns/10 Total Years) = 90%. This would be a pretty good stock to invest in based on its high level of predictability.


