The Nasdaq Stock Market is an American stock exchange based in New York City. It is ranked second on the list of stock exchanges by market capitalization of shares traded, behind the New York Stock Exchange. The exchange platform is owned by Nasdaq, Inc., which also owns the Nasdaq Nordic stock market network and several U.S. stock and options exchanges.
All data and analysis provided here are for information only. All data and analysis contained herein are provided without warranty or guarantee of any kind, either expressed or implied. Using this data and analysis could incur substantial financial losses. The provider of this data and analysis shall not have any liability for any loss sustained by anyone who has relied on the data and analysis contained herein. The provider of this data and analysis makes no representation
or warranty that the information contained herein is accurate, fair, or correct or that any transaction is appropriate for any person and it should not be relied on as such.
Related Reports
Volatility Report tutorial
Volatility Report:
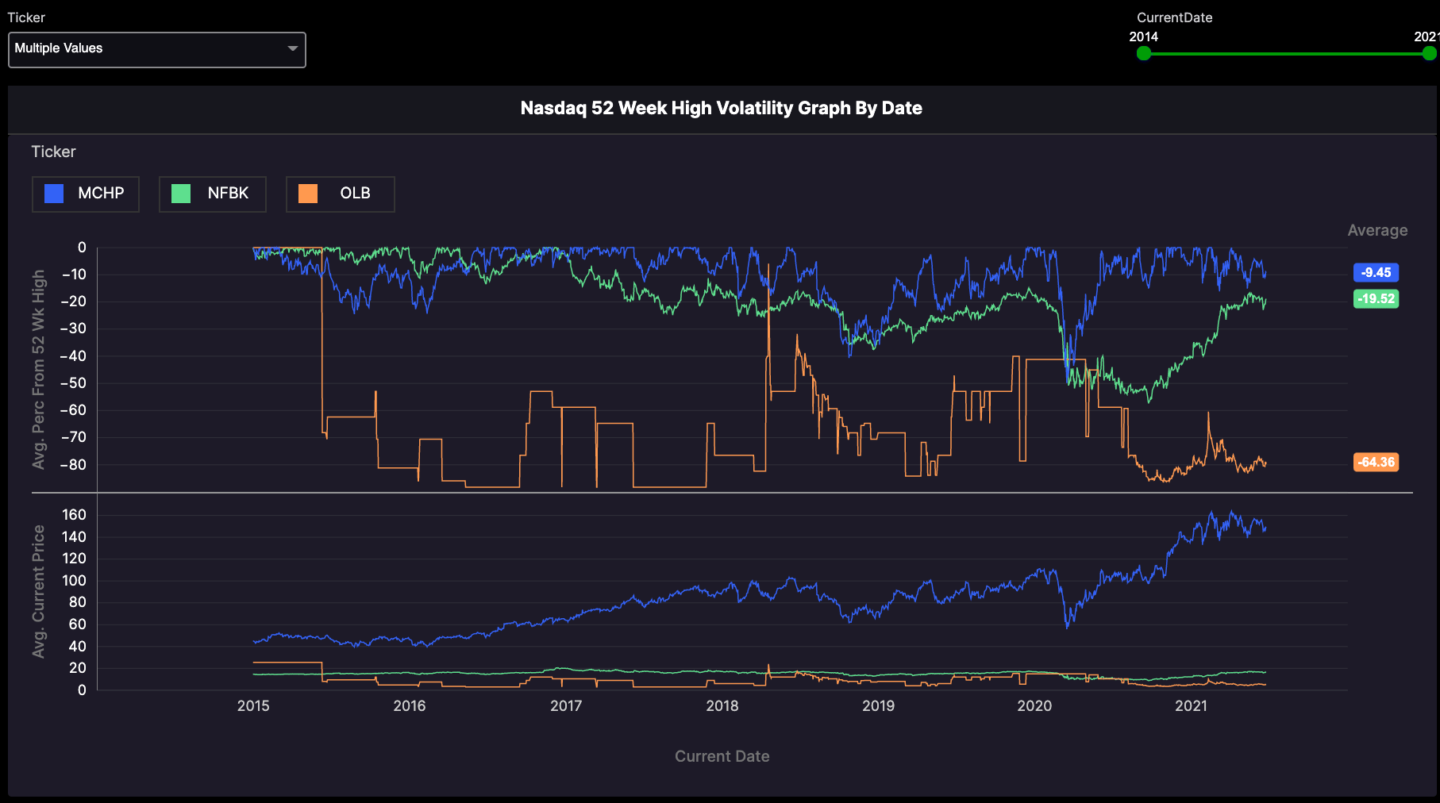
This report looks at the volatility of stock. It looks like at how far a stock is from its 52 week high historically. Each time a stock hits 0 means it made a new 52 week high or it is 0% from its 52 week high. This report can show you many things such as the average percent a stock trades from its 52 week high. You can also compare more than one stock to get a gauge of what stocks will drop more or less during a sell off. See the screenshot below.
You can see in the differences in the screenshot above between Microsoft (blue line) and Tesla (Red Line). This graph tells you a couple things:
- Microsoft is a much more stable stock. You can see it has hit way more 52 week highs than Tesla.
- You can see Tesla is has much more wilder swings.
- Microsoft plays offense and defense and is a stock to own during market downturns.
- You can also get a gauge of time between 52 week highs. You can see Microsoft’s gap is much small than Tesla’s. Meaning in can be years before a stock like Tesla hits another 52 week high where as Microsoft it will typically be less than a year.
You can also get a gauge of the average percent difference a stock trades from a 52 week high. In the case of Microsoft it’s Average percent difference from its 52 week high is about -6.70% this suggest that anything below -7% is a good time to buy a stock like Microsoft. You can see that Microsoft has only fallen more than 25% just a few times since 2009. Suggesting that this is a great defensive play. See the screenshot below:
You can also adjust the date to drill down into this report to see how the volatility changes using the date slider:


